
16.40× on Meta, 9.61× on Google — Six Ad Accounts, Each Reported on Its Own Line
Six accounts across Meta and Google, bought against four different objectives — purchases, app installs, leads and WhatsApp conversations. Every account is reported on its own line, because a blended agency average hides the only decision that matters.
- Client
- Six advertising accounts across e-commerce, retail and a consumer app
- Industry
- Multi-industry · E-commerce, retail and technology
- Scope
-
- 6 ad accounts across Meta and Google
- Purchase, install, lead and messaging objectives
- Per-campaign and per-channel reporting
- Funnel tracking from reach to purchase
The challenge
Six advertising accounts, and no two of them buying the same thing.
A gemstone and rudraksh retailer was selling by word of mouth with no repeatable way to acquire customers online — earlier attempts had spread a small budget across too many objectives, so nothing gathered enough data to optimise and nothing could be judged fairly. An online fragrance and lifestyle store had traffic but no visibility into where shoppers dropped out; sales arrived as one monthly number, which made every performance conversation a guess. A consumer app needed installs at volume with no read on which Google channel could deliver them. An apparel brand selling into the US and UK needed revenue, not traffic. A saree reselling brand wasn’t chasing a checkout at all — it wanted conversations.
The common failure mode across all six is the same one: a single blended agency number. It flatters the weak accounts, buries the strong ones, and tells nobody which channel should get the next rupee.
What we did
Reported every account on its own line. No blended ROAS, no agency-wide cost per result. Each account is judged against the objective it was actually bought for.
Rebuilt the Meta accounts around purchase optimisation, consolidating spend so campaigns could exit the learning phase instead of stalling in it.
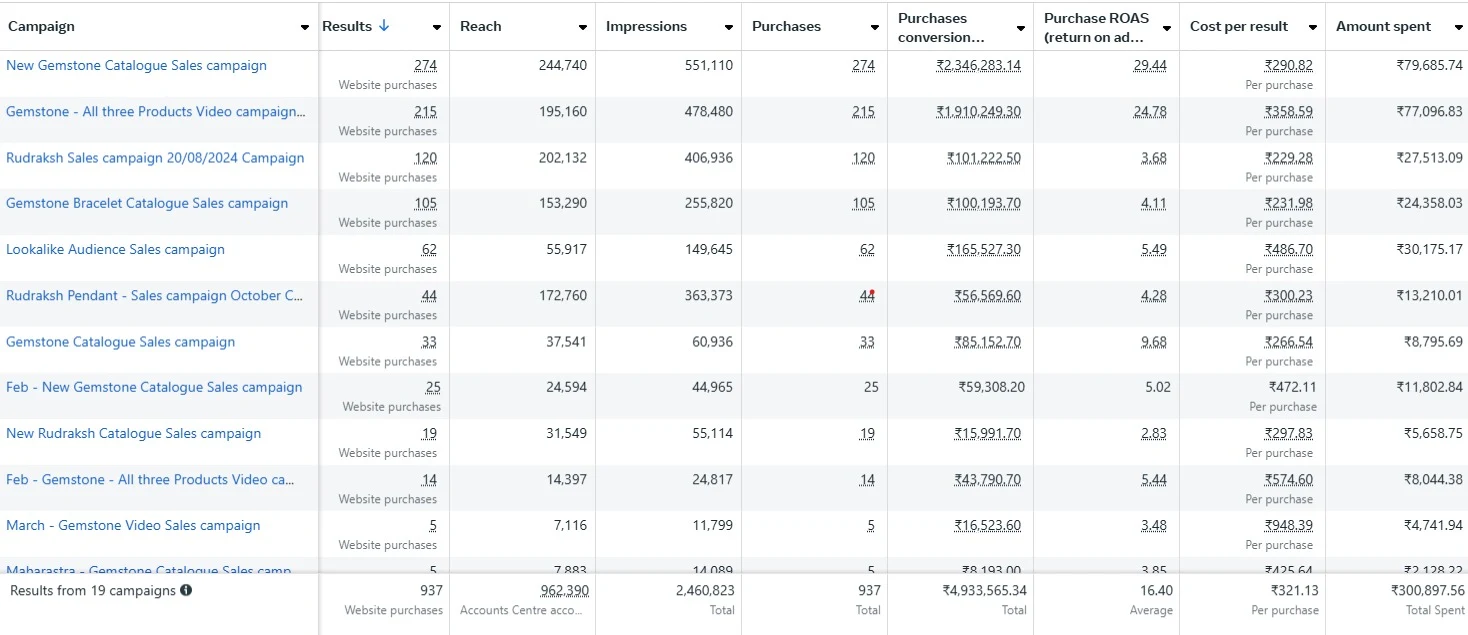
Led with product video. One piece of creative showing all three products returned a 24.78 ROAS on 215 purchases. The full catalogue, run as its own campaign, did better still on both counts — the account’s highest volume at 274 purchases and its best return at 29.44.
Split the product lines. Gemstone and rudraksh were separated so a weaker line could be diagnosed and funded independently rather than dragging the blended number down.
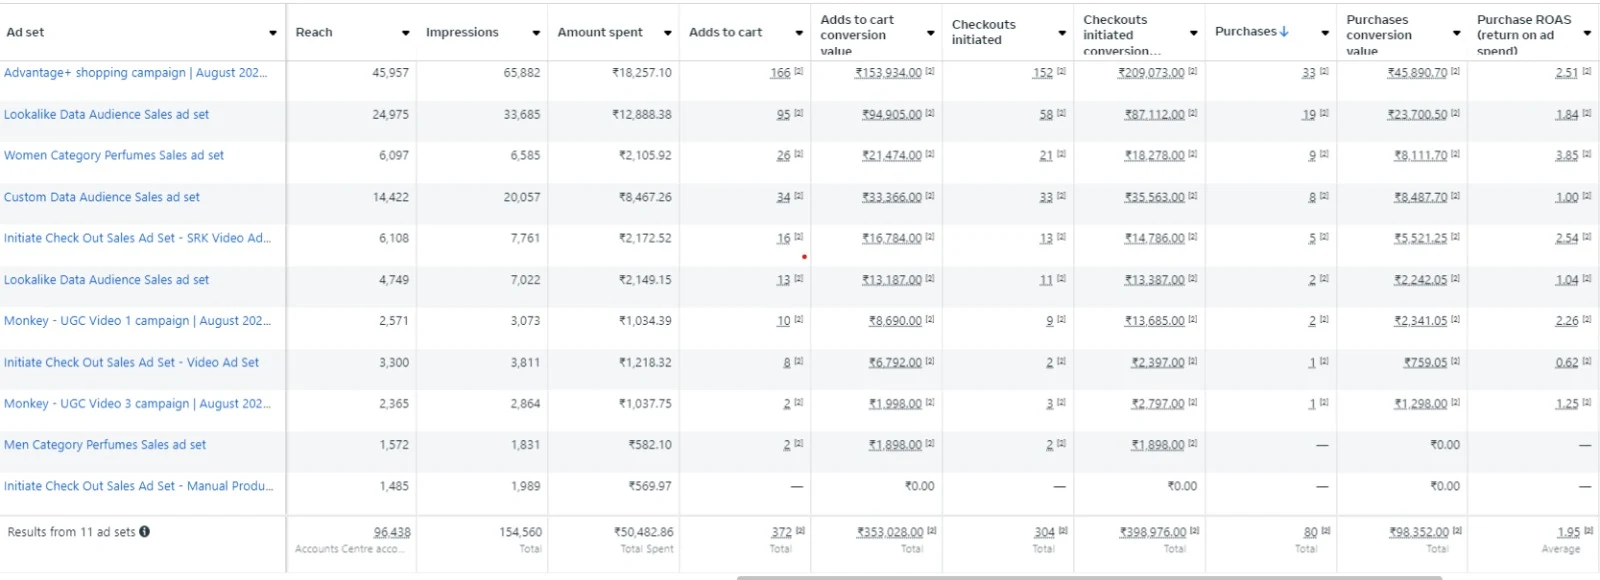
Instrumented the whole funnel. On the store, reach, add to cart, initiated checkout and purchase were tracked per ad set, so drop-off had a location rather than a theory.
Ran all four Google channels separately — YouTube for reach, Display for efficiency, Search kept small and intent-led, Search Partners read honestly — so each could be judged on its own cost per install and conversion rate.
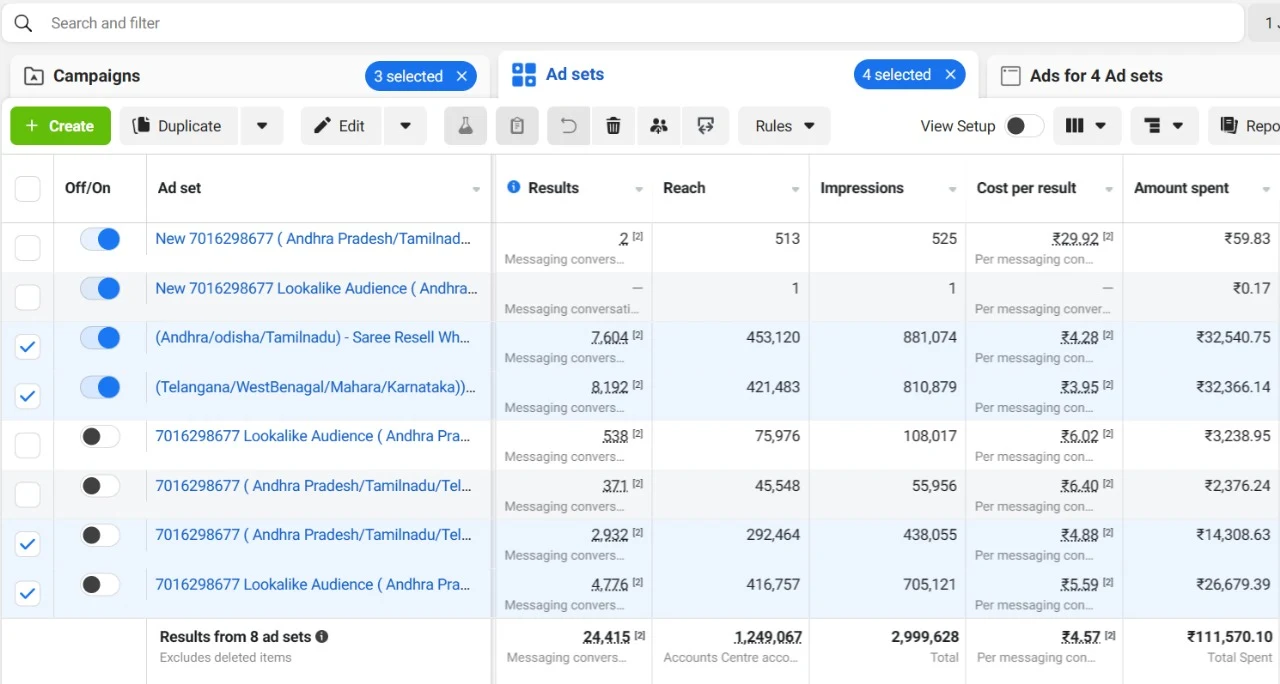
Matched the objective to the business. The saree account was bought against messaging, not purchases, because that is where its sales conversation actually happens.
The result
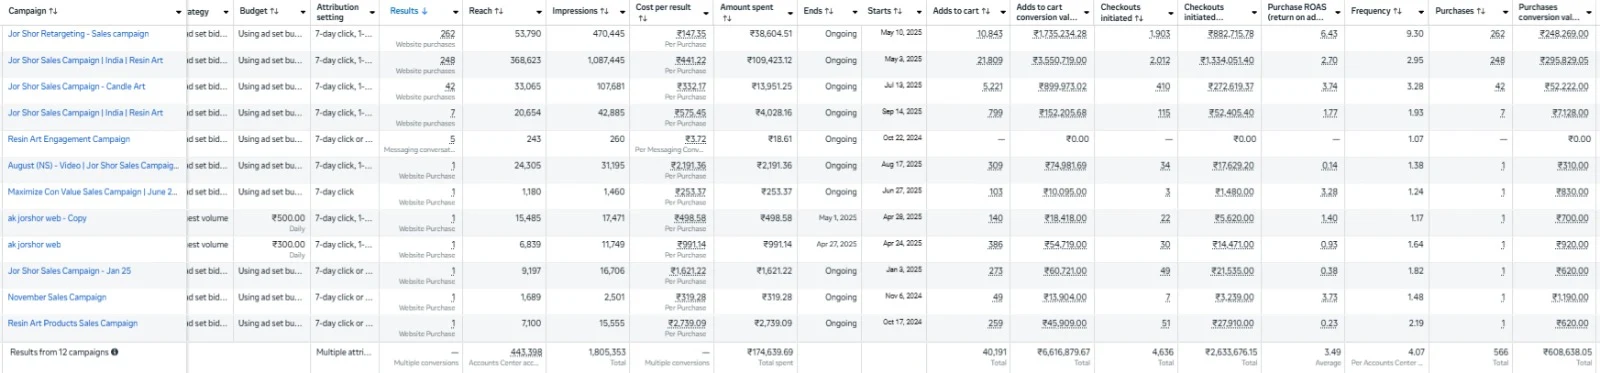
On Meta, the gemstone portfolio delivered 937 purchases at a 16.40 average ROAS, at ₹321 per purchase on ₹3.01 Lakh of spend. Jor Shor returned 3.49 across twelve campaigns. The saree account produced 24,415 WhatsApp conversations at ₹4.57 each.
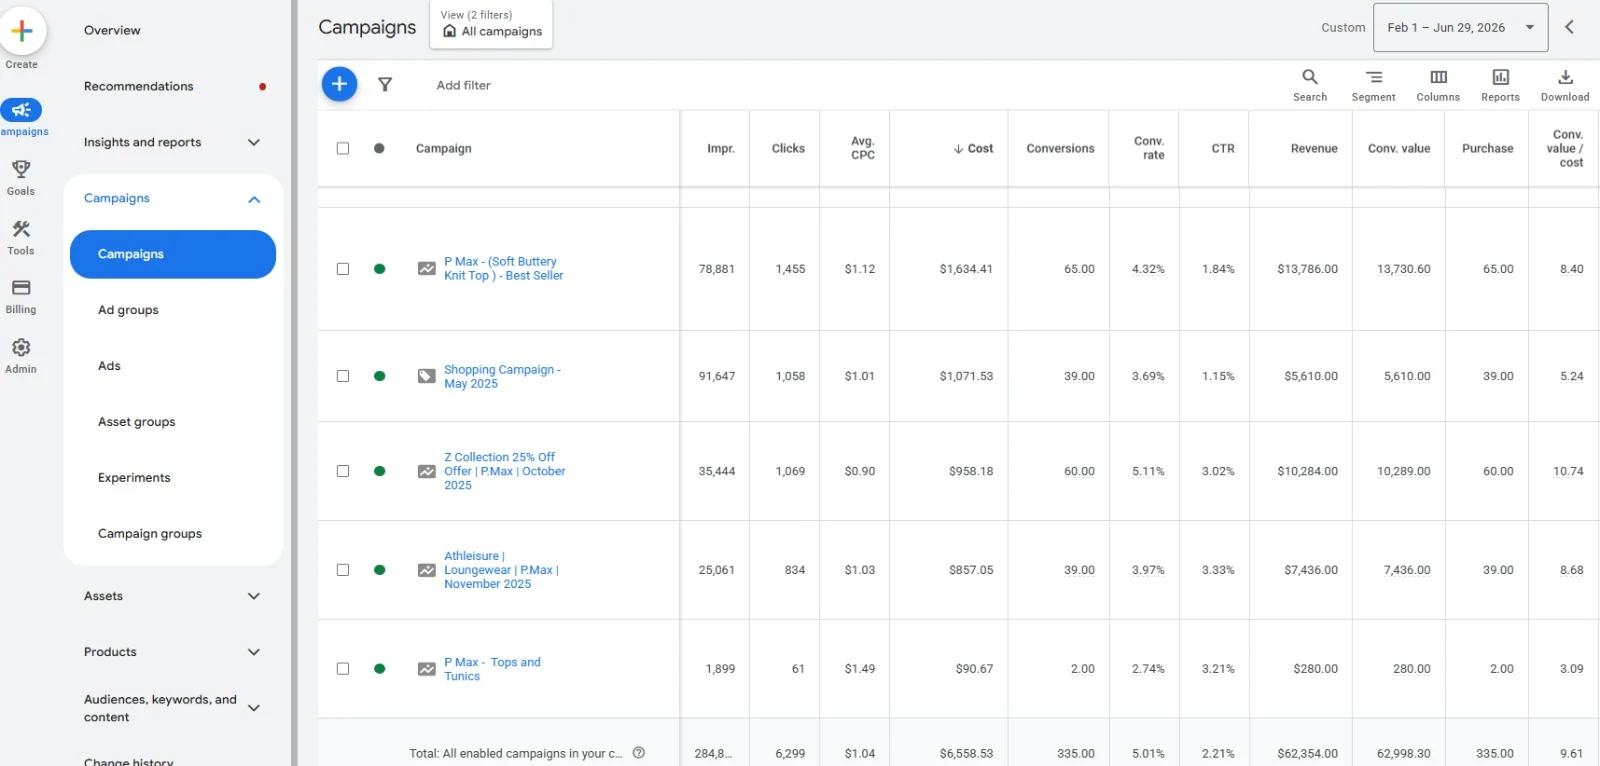
On Google, the app campaign produced 389,009 clicks and 36,320 installs at ₹5.05 each, converting at 3.23% across all channels; the apparel account returned $62,354 of revenue on $6,558.53 of spend — 9.61× conversion value over cost.
In every one of them the average was the least interesting number. Two gemstone campaigns cleared 24× while the rudraksh line sat at 3.68 — still profitable, but a different economic profile, and keeping them separate is what made both facts visible. On Google, Search Partners converted at 33.97% against YouTube’s 2.83%: a twelvefold gap that a single blended figure hides completely.
The most valuable output of the six wasn’t a sale at all. On the fragrance store, 304 shoppers reached checkout and 80 finished. The sharpest available gain there wasn’t more ad spend — it was the checkout itself, and that gap is far cheaper to close on-site than to buy again through the ad account.
A blended number hides the only decision that matters: which account, which channel, gets the next rupee.
Running Meta or Google and unsure whether the problem is the ads or the site? Book a free account audit.
What the platforms reported
Straight from the dashboards, per campaign and per channel — the same view the client sees.
 View full size
  View full size
  View full size
  View full size
  View full size
  View full size
  View full size
 The six accounts at a glance
Different platforms, different objectives, different economics. Listed together, reported separately.
| Account | Platform | Objective | Headline result | Spend |
|---|---|---|---|---|
| Gemstone & rudraksh brand Top ROAS | Meta | Purchases | 937 purchases at 16.40× ROAS | ₹3.01 L |
| Perfume & lifestyle store | Meta | Purchases | 80 orders from 304 checkouts | ₹50,483 |
| Jor Shor — resin & candle art | Meta | Purchases | 566 purchases at 3.49× ROAS | ₹1.75 L |
| Saree reselling brand Highest volume | Meta | Messaging | 24,415 conversations at ₹4.57 | ₹1.12 L |
| Consumer mobile app | App installs | 36,320 installs at ₹5.05 | ₹1,83,399 | |
| Apparel eCommerce, US & UK Best return | Sales (P.Max) | $62,354 revenue at 9.61× | $6,558.53 |
No total. The accounts run against four different objectives in two currencies — a conversation at ₹4.57 and a purchase at 16.40× ROAS are not the same unit, and adding them would produce the blended number this study exists to argue against.
Meta — gemstone & rudraksh, top performing campaigns
A 19-campaign purchase-optimised portfolio for a high-consideration product.
| Campaign | Purchases | Reach | Impressions | ROAS |
|---|---|---|---|---|
| New Gemstone Catalogue Sales Campaign Top ROAS | 274 | 244,740 | 551,110 | 29.44 |
| Gemstone — All Three Products Video High ROAS | 215 | 195,160 | 478,480 | 24.78 |
| Gemstone Bracelet Catalogue Sales Campaign | 105 | 153,290 | 255,820 | 4.11 |
| Rudraksh Sales Campaign 20/08/2024 | 120 | 202,132 | 406,936 | 3.68 |
| All 19 campaigns | 937 | 962,390 | 2,460,823 | 16.40 |
Figures as reported in Meta Ads Manager. Reach is the account-level deduplicated figure, so it is lower than the sum of the campaign rows.
Meta — perfume & lifestyle store, shopping ad sets
Eleven shopping ad sets on ₹50,483 of spend, tracked all the way from cart to purchase.
| Ad set | Reach | Impressions | Adds to cart | Checkouts | Purchases | Spend |
|---|---|---|---|---|---|---|
| Advantage+ Shopping Campaign Top | 45,957 | 65,882 | 166 | 152 | 33 | ₹18,257.10 |
| Lookalike Data Audience Sales High | 24,975 | 33,685 | 95 | 58 | 19 | ₹12,888.38 |
| Women Category Perfumes Sales Best ROAS | 6,097 | 6,585 | 26 | 21 | 9 | ₹2,105.92 |
| Custom Data Audience Sales | 14,422 | 20,057 | 34 | 33 | 8 | ₹8,467.26 |
| Initiate Checkout Sales — SRK Video Ad | 6,108 | 7,761 | 16 | 13 | 5 | ₹2,172.52 |
| Lookalike Data Audience Sales (2) | 4,749 | 7,022 | 13 | 11 | 2 | ₹2,149.15 |
| Monkey — UGC Video 1 | 2,571 | 3,073 | 10 | 9 | 2 | ₹1,034.39 |
| Initiate Checkout Sales — Video Ad Set | 3,300 | 3,811 | 8 | 2 | 1 | ₹1,218.32 |
| Monkey — UGC Video 3 | 2,365 | 2,864 | 2 | 3 | 1 | ₹1,037.75 |
| Men Category Perfumes Sales | 1,572 | 1,831 | 2 | 2 | — | ₹582.10 |
| Initiate Checkout Sales — Manual Products | 1,485 | 1,989 | — | — | — | ₹569.97 |
| All 11 ad sets | 96,438 | 154,560 | 372 | 304 | 80 | ₹50,482.86 |
Figures as reported in Meta Ads Manager across 11 shopping ad sets. Reach is the account-level deduplicated figure. The 11 ad sets returned ₹98,352 of purchase conversion value, a 1.95 average ROAS.
Google — app install campaign, by advertising channel
Four channels, reported separately — which is the whole point.
| Channel | Clicks | Impressions | Installs | Cost / install | Conv. rate | Spend |
|---|---|---|---|---|---|---|
| YouTube High volume | 261,508 | 3,943,099 | 28,241 | ₹5.27 | 2.83% | ₹148,853.51 |
| Google Display Network | 118,237 | 2,236,700 | 5,475 | ₹4.18 | 4.61% | ₹22,876.11 |
| Google Search Best CPI | 7,651 | 330,291 | 2,056 | ₹4.24 | 26.87% | ₹8,714.50 |
| Search Partners Best conv. rate | 1,613 | 231,490 | 548 | ₹5.39 | 33.97% | ₹2,955.03 |
| Total (all channels) | 389,009 | 6,741,580 | 36,320 | ₹5.05 | 3.23% | ₹183,399.15 |
Every figure here is as reported in Google Ads — clicks, impressions, installs, cost per install, conversion rate and spend all come straight off the export shown above.